GIS Banjir Jakarta
Web GIS for Flood Risk Mapping and Geographic Data Integration
A team Web GIS project integrating flood-risk, waterway, population, and weather-related geographic data to provide a centralized view of Jakarta's flood vulnerability.
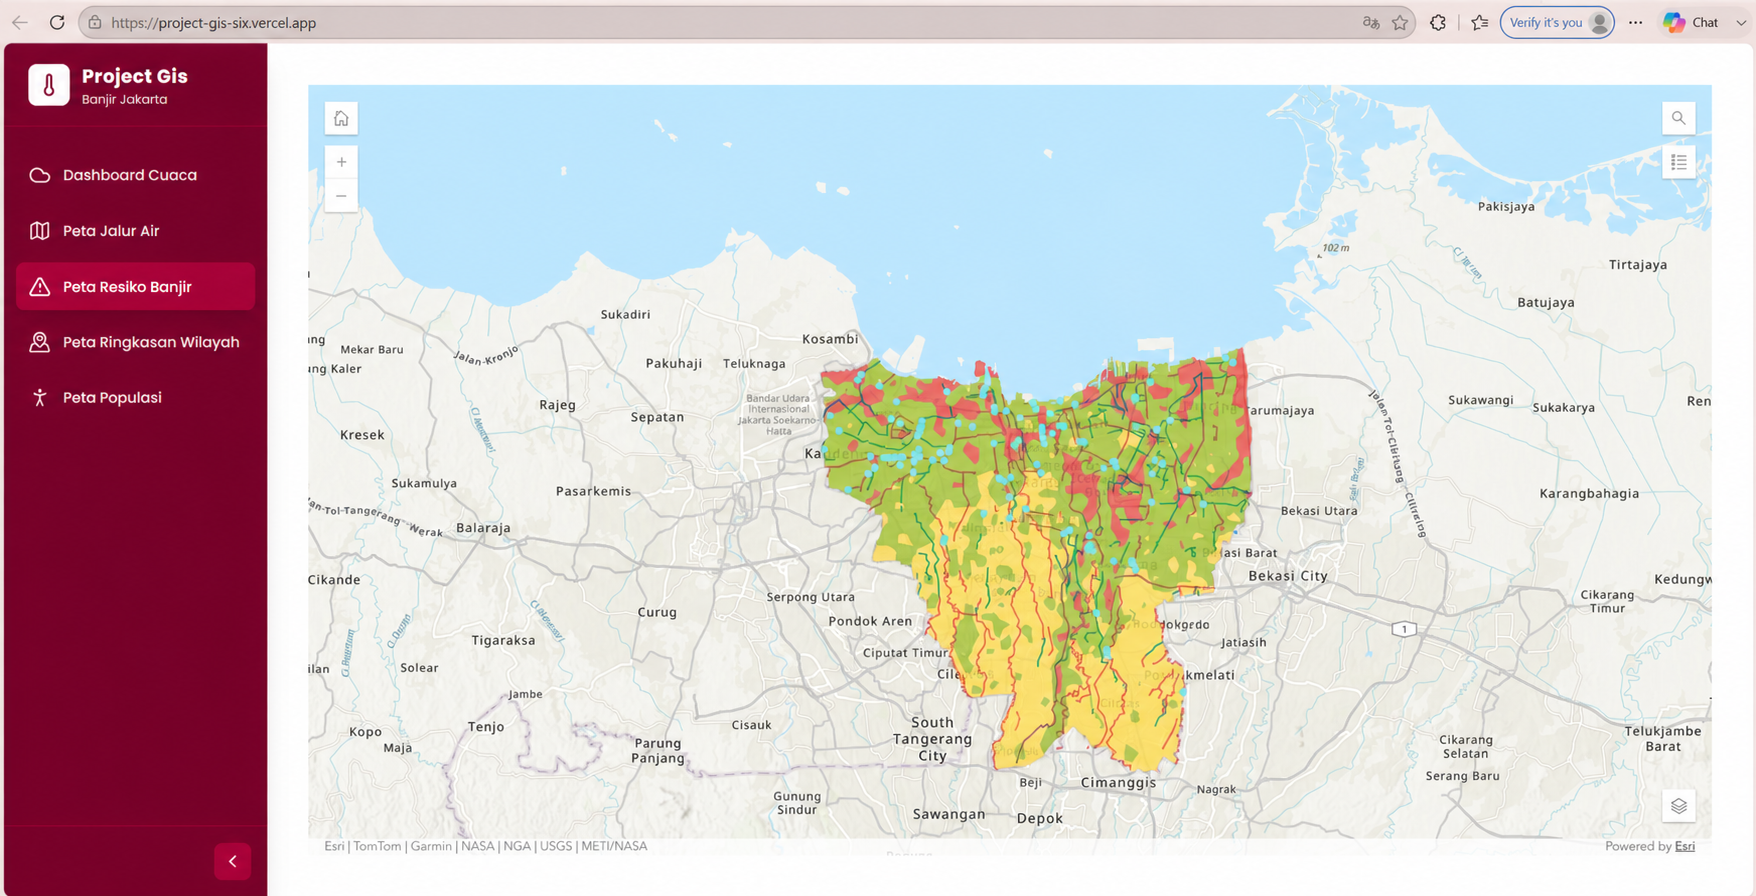
Bringing flood context into one map-based view.
Jakarta is highly vulnerable to flooding due to its low-lying geography, dense river systems, and extreme rainfall. Relevant information is often distributed across independent geographic and weather sources.
The project consolidates these inputs into structured map layers so flood risk, waterways, population, and supporting weather information can be viewed together.
From geographic data to map layers.
A structured data workflow prepares multiple sources for a unified ArcGIS visualization.
Flood risk & waterway data
Flood Risk Index polygons were acquired from an ArcGIS REST Feature Layer. Indonesia-wide HOTOSM / HDX waterway data was filtered specifically for Jakarta.
GeoJSON to ArcGIS layers
Geographic data was cleaned, organized, and prepared as GeoJSON and ArcGIS Feature Layers before being made available for dashboard integration.
Preparing map data for the final system.
ArcGIS was used as the processing and mapping environment to prepare flood-risk polygons, filtered waterway routes, and other geographic layers for the Web GIS dashboard.
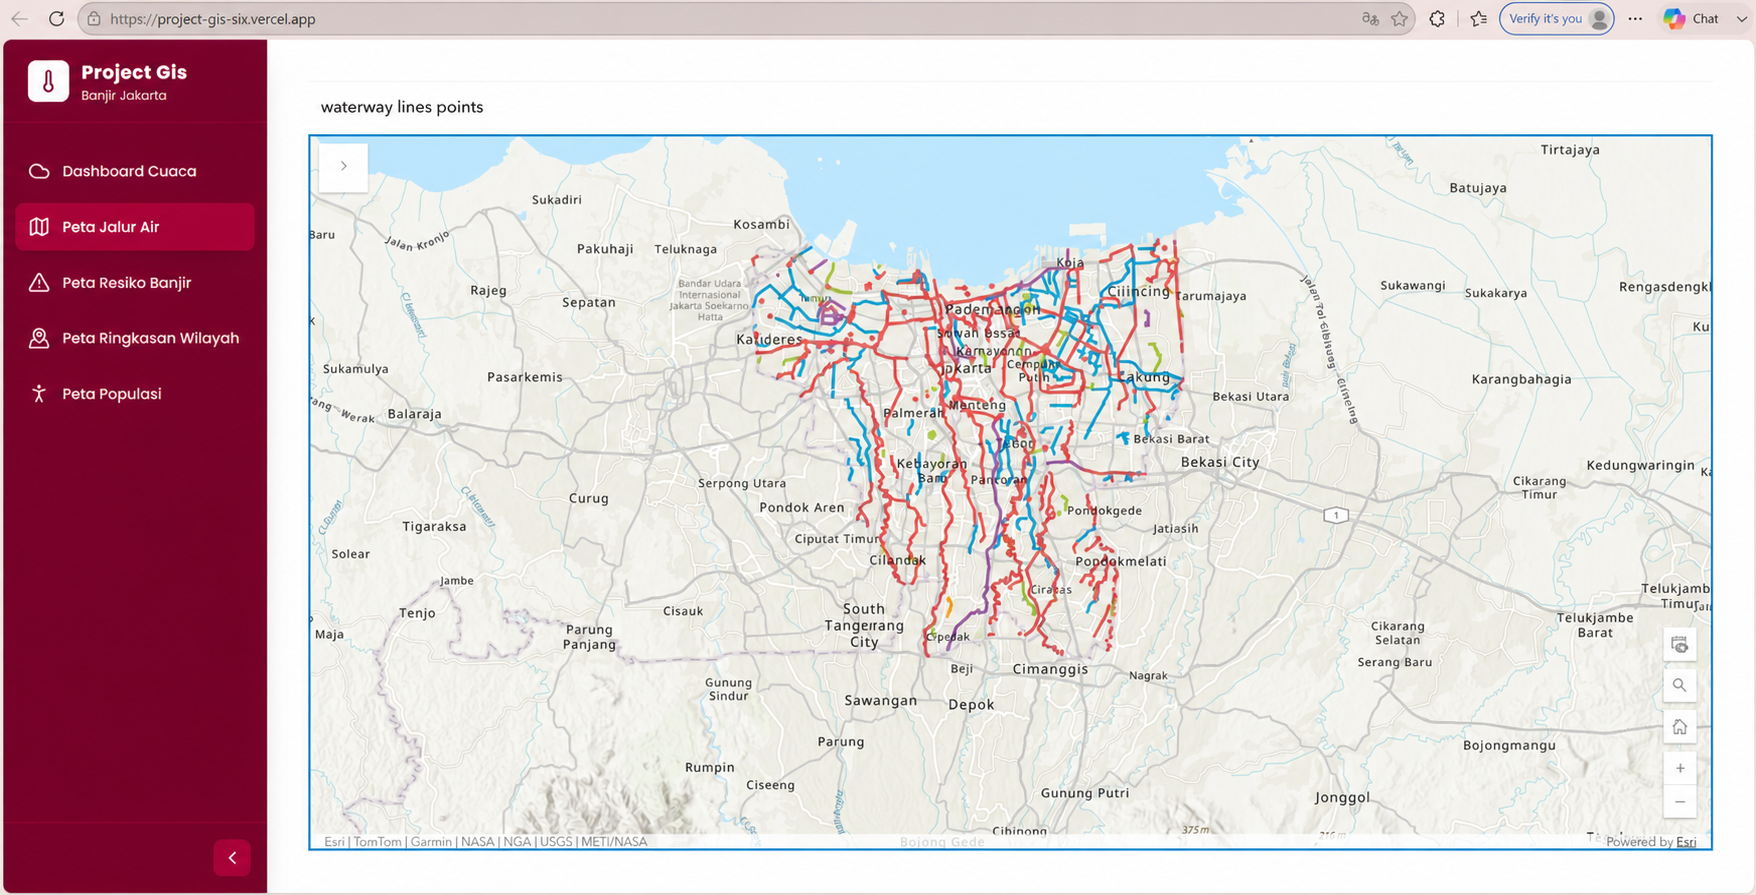
GIS data & system analysis.
I focused on geographic data acquisition, preparation, and ArcGIS layer work—not on developing the final dashboard frontend.
Geographic data collection
Flood-risk map data acquisition
Waterway / river data acquisition
Jakarta-specific dataset filtering
GeoJSON and ArcGIS preparation
System analysis & integration support
Another team member handled integration of the prepared ArcGIS outputs into the final Web GIS dashboard.
A clearer spatial view of flood vulnerability.
The final Web GIS offers map-based views for weather, waterway routes, flood risk, regional summaries, and population data.
Explore the Web GIS Project
View the GIS dataset preparation, GeoJSON layers, or team repository on GitHub.